** Update: It’s hard to tell but I think PIX is no longer a free app and is now part of Visual Studio :/ I have started using Intel’s profiler/debugger which is quite good but requires you to have an intel card you can use **
What the Fuck!
What the Fuck is it DOING!?
Why in the name of hell isn’t it working?
These are just a few of the fun phrases you can apply in the fun field of Shader programming with Flash’s new Stage3d API.
Shaders are cool as hell. In my last post I wrote up an example of a pixel shader that makes grass wave in the wind. It was a pretty simple 7 line shader and I managed to write it without a debugger of any kind.  The real problem comes when you want to write something more complicated. Then the lack of any solid feedback will start to drive you crazy. You will begin to fantasize about introducing axes to graphics cards with great force. Fortunately Microsoft, in a rare show of magnanimity, has given us a way out.
There is a tool in DirectX Utilities called PIX which can be used to examine shader variables as well as step through their operation! In a perfect world that would be all the instruction required: use PIX. Unfortunately PIX has a bit of a learning curve and there are a few bends to the curve that are far from obvious so I’m going to tediously document every little step.
I’m going assume you have the standalone flash player. But you will need that if you don’t have it. This example is going to use my simple Shader Testbed which you can download from this post.
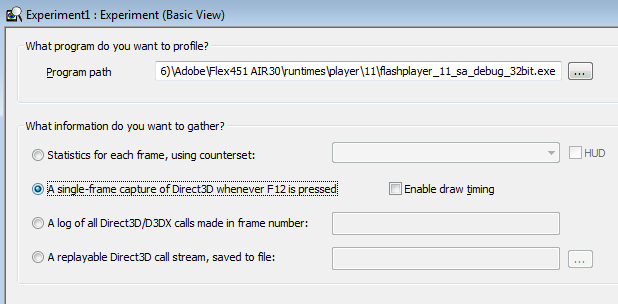
First go download DirectX and install it. *I don’t think this link will get you PIX anymore* Now run PIX which is one of the DirectX Utilities in your start menu. Inside PIX select file->New Experiment You will be presented with a window that looks like this: 
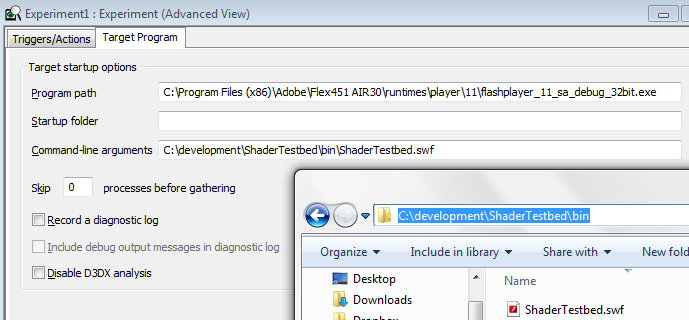
Provide the path to your flash stand alone player in the Program path field. Select the “a single-frame capture of Direct3D whenever F12 is pressed” radio button. Now click the “more options” button and then the “Target Program” tab. 
In the “Command-line arguments” field fill in the path to your swf. Now hit “Start Experiment”. If your swf doesn’t start running then you’ve got a filename wrong or something.
Ideally now your swf is running. Do whatever you have to do to get your shader running and the results on the screen. For my Shader Testbed example I’m going to paste in the wavy grass shader.
The moment has come. Now hit F-12. This will capture the state of the program on that frame. Close your swf. This will bring up PIX’s analysis window which is chock-a-block with stuff. You want to debug a pixel and look at watch the shader modify its value. To do that:
- Select the frame you captured
- Select the render tab, this will bring up a screenshot of the frame in question
- Right click on the pixel you’re interested in and select “Debug This Pixel”
Now you’ll get a list of draw calls pertaining to that pixel. Unfortunately for some reason it won’t include the draw call you care about. Or it will, but it won’t include your shader… or something. For whatever reason you can’t debug your shader from here. You can debug some shader here but you can’t debug your shader here.
To debug your shader you have to select the specific draw call that displays your texture. You can find that by expanding the Frame and finding the draw call manually.
After expanding the Frame press the “Next Draw Call” button. It’s a capital D with an arrow next to it. Then make sure you have the “render” tab open on the right.
Watch the screenshot on the right and go from draw call to draw call until your texture shows up. Now stop hitting the “Next Draw Call” button or you’ll get back to the useless state. Ok, now go back to the Render window and right-click a pixel on your texture and select “Debug This Pixel”. ![]()
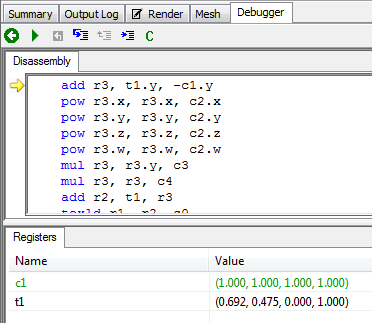
This time it will actually work! Hit the “Debug Pixel” link and you will get to step through your shader code and inspect the registers!
It’s not in AGAL, it’s in some other shader assembly but, you know, seen one shader assembly language you seen ’em all really.
So, yeah, that did take a fair amount of work and yes, the turn around time between debug sessions isn’t great. But damn it shaders are super cool and if you want to do much with them then you’re going to have to be able to do some debugging.
Hope you found this useful. It took me a while to figure out. Also, if you have trouble finding the right draw call you can always use the “Objects” window to find the memory address of your particular shader, search the Frame for that address, and then you know the next draw call is the one you want.
Woo! Shaders!


Comments
24 responses to “Debugging Shaders in Flash with PIX”
Good article.
Has anyone had any luck getting PIX working with stage3d content running the flash web player? Our app has a lot of functionality that won’t work in the standalone player (web requests, for example), and it’s a hassle to maintain a parallel AIR build.
Tools like Intel IGA ‘just work’ even with Chrome, but pix doesn’t.
Very Good
I think you need directX SDK( not the end user version like in the above link). Anyway I have no utilites after install directX through the link.
I think they may have taken it away and added it to Visual Studio, which is pricey :/
Thanks for this super helpful. Looks like you can still download PIX from here… for free!!
DirectX SDK (9.24.1400): http://www.microsoft.com/en-us/download/details.aspx?id=22508
Adobe have recently released a new tool called Adobe Scout, that should be useful to you:
http://gaming.adobe.com/technologies/scout/
It’s a profiler for Flash, but it also lets you debug your Stage3D content – and there’s a built-in AGAL editor. It doesn’t support shader debugging, like in PIX, but it will let you edit a shader and immediately re-render the entire scene. That way, you can quickly play around with the shader until you get it right! Plus, you can use it with any Flash content (on mobile, desktop, or in the browser).
You can try Scout now as a free trial – you just need to register for a free Creative Cloud account. Sometime later this year it’ll become a paid product (there will still be a free version, but you’ll need a paid Creative Cloud account to use the advanced features like Stage3D debugging).
It’s worth checking out, to see if you find it useful!
Thanks for the info, it really helped getting started with PIX. I’m using it in Unity and it is becoming an indispensable part of my gfx programming workflow.
… [Trackback]
[…] Find More Info here on that Topic: northwaygames.com/debugging-shaders-in-flash-with-pix/ […]
… [Trackback]
[…] Read More Information here to that Topic: northwaygames.com/debugging-shaders-in-flash-with-pix/ […]
… [Trackback]
[…] Information to that Topic: northwaygames.com/debugging-shaders-in-flash-with-pix/ […]
… [Trackback]
[…] Find More on that Topic: northwaygames.com/debugging-shaders-in-flash-with-pix/ […]
… [Trackback]
[…] Find More Information here on that Topic: northwaygames.com/debugging-shaders-in-flash-with-pix/ […]
… [Trackback]
[…] Read More to that Topic: northwaygames.com/debugging-shaders-in-flash-with-pix/ […]
… [Trackback]
[…] Find More Info here to that Topic: northwaygames.com/debugging-shaders-in-flash-with-pix/ […]
… [Trackback]
[…] Information on that Topic: northwaygames.com/debugging-shaders-in-flash-with-pix/ […]
… [Trackback]
[…] Read More on that Topic: northwaygames.com/debugging-shaders-in-flash-with-pix/ […]
… [Trackback]
[…] There you will find 49433 additional Information on that Topic: northwaygames.com/debugging-shaders-in-flash-with-pix/ […]
… [Trackback]
[…] Find More Information here to that Topic: northwaygames.com/debugging-shaders-in-flash-with-pix/ […]
… [Trackback]
[…] Read More to that Topic: northwaygames.com/debugging-shaders-in-flash-with-pix/ […]
… [Trackback]
[…] Find More to that Topic: northwaygames.com/debugging-shaders-in-flash-with-pix/ […]
… [Trackback]
[…] There you can find 6069 more Information on that Topic: northwaygames.com/debugging-shaders-in-flash-with-pix/ […]
… [Trackback]
[…] Find More Info here on that Topic: northwaygames.com/debugging-shaders-in-flash-with-pix/ […]
… [Trackback]
[…] Read More Info here on that Topic: northwaygames.com/debugging-shaders-in-flash-with-pix/ […]
… [Trackback]
[…] Find More to that Topic: northwaygames.com/debugging-shaders-in-flash-with-pix/ […]