Hello to you sirs and madames. I would like to introduce you to a talented young man by the name of Thomas Shahan.
I found Thomas through a lucky turn of chance while I was perusing Wikipedia.

I was looking up jumping spiders while we were in the Philippines because we had a lot of beautiful spiders running around. His astounding Phidippus Mystaceus picture caught my eye and I absent-mindedly decided to find out who had taken it. That brought me to ThomasShahan.com.

I always wanted Incredipede to look like a Victorian illustration. While I was working on the game in Costa Rica I spent hours poring over old illustrated texts of botanists who had traveled to far off corners of the world.
My favorite is Berthe Hoola van Nooten who traveled through Java and Surinam in the late 1800’s. Her work was lavish and colourful and her write-ups included rich details about how locals used the plants. She instilled the illustrations with a sense of the wider world. I can’t imagine how exciting it must have been to read her book in 1880.
I was so taken with her work that originally Incredipede was in the form of a book. Each level had text on one side and a level on the other.
So it was in this context that I discovered Th0mas’ illustrations.

Thomas’ woodblock cuts harken back to an earlier era than I was focused on. But his absolute reveling in the squishy fecundity of nature amazed me! His work has such a sense of place. It’s so disturbingly fascinating.
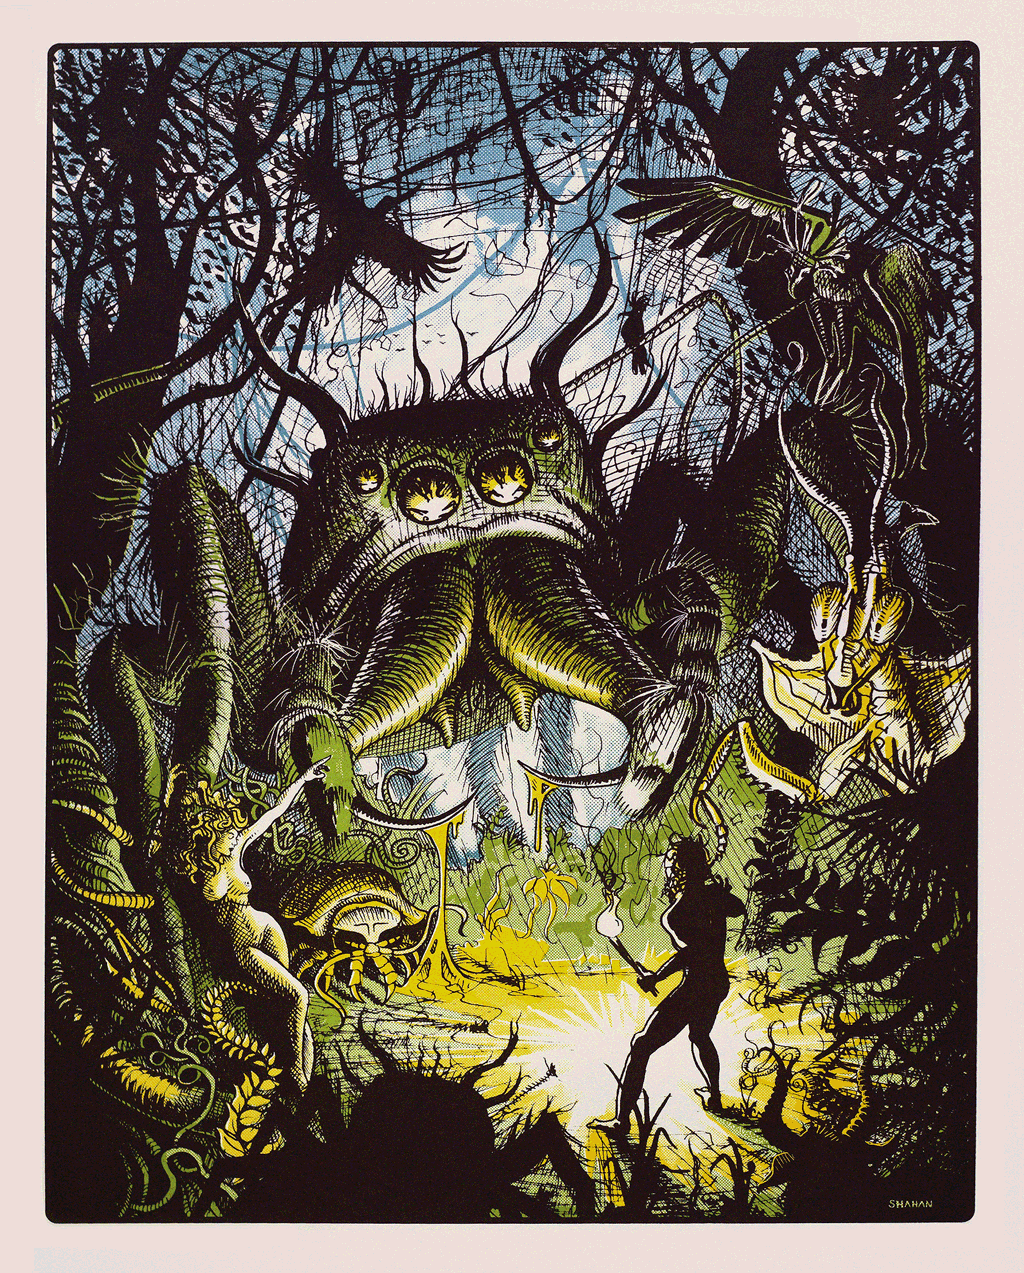
I sent him an email asking if he was free and possibly interested in working on a video game. It turns out he was just finishing art school and was interested. I sent him a screenshot of the game and he sent me a mock-up of the screenshot as it might appear with his art. I was blown away by the result.
It turns out he’s also a pretty big video game nerd. When we started corrosponding he sent me a link to an old Genesis shooter called Bio-Hazard Battle which has a nice organic feel. I’ve also seen him go toe to toe with Alex Neuse in an Atari nostalgia-off. Which makes no real sense since Thomas is way too young to have played any Atari games.

A few weeks ago Thomas came out to San Francisco where Sarah and I are staying and we spent a solid week on the game together (although we did find time to go spider hunting in Golden Gate Park).
So far he’s been doing an amazing job. I put together a secret game-play video and showed it around GDC and people went a little nuts for it.
I’ll begin showing off his work in future posts. I don’t want to show you everything at once for fear of blowing your mind out through the top of your skull.





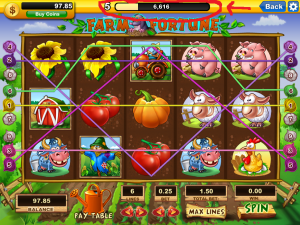
 That’s an xp bar. You can level this slot machine. When you level you get access to more games (well, the same game reskinned) and you raise your minimum bet. You gain xp purely by spending credits. The more credits you gamble the more you level. Of course you run out of credits about two and a half games in so the only way to unlock more is by paying real money.
